
Talbot Financial – 3Q 2018 Review
The financial news headlines in the third quarter featured macro-level themes such as trade wars, inflation and central bank interest rate decisions. Meanwhile, the continued strength of the U.S. economy and corporate earnings were the key relevant factors driving favorable investment returns during the third quarter.
Fortunately, for us as investors it is the fundamentals of the companies we own and the underlying condition of the economy that matter the most over the long-term, not the media rhetoric. As evidence, for the third quarter Talbot Financial’s benchmark index, the S&P Total Return Index (“Index”), increased 7.7%. Year-to-date, the Index was up 10.6% through Sept. 30, 2018.
Investment returns during the third quarter were led by Health Care, Industrials, Communication Services and Technology, all of which posted returns of greater than 8%. Materials, Energy, and Real Estate were the underperforming industry sectors.
As of the end of the third quarter, we are in the 10th year of an economic and stock market rebound, the length of which has some questioning what “inning” of the current expansion we are in using a baseball analogy. We feel the factual evidence indicates this rally still has some legs and a recession is not imminent based on three considerations. First, although it is the second longest expansion on record, it is weak by historical standards. Secondly, the leading economic indicators do not imply a recession is imminent. Thirdly, and specific to the stock market, valuations for equities are at their long-term average.
To illustrate the first point referenced above, the following chart shows all post World War II economic expansions in terms of both length and strength. The length of the current recovery, as depicted by the dark black line, receives a lot of attention as it is now the second longest on record.
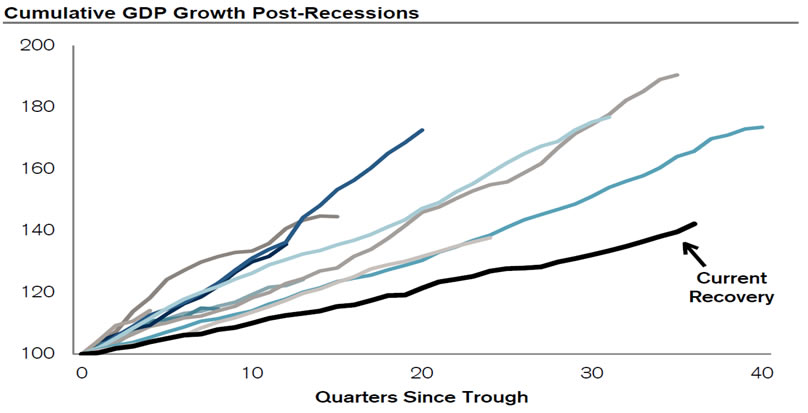
According to the National Bureau of Economic Research (NBER), there have been 11 post World War II economic expansions. The average expansion lasted 59-months and Gross Domestic Product (GDP) grew at an average of 4.3%. The current expansion just marked its 111th month, making it the second longest on record. However, GDP has grown at only 2.2% during this period, making it the second weakest recovery on record. Therefore, our view is the expansion should continue as the fundamentals remain intact.
Next, listed below in the table are a number of warning signals that typically precede a recession. A downward arrow means the indicator suggests a recession, while an upward pointing arrow suggests expansion. In the six previous recessions the majority of the leading indicators were suggesting the recession was imminent. Currently, all but one of the indicators suggest an expanding economy.

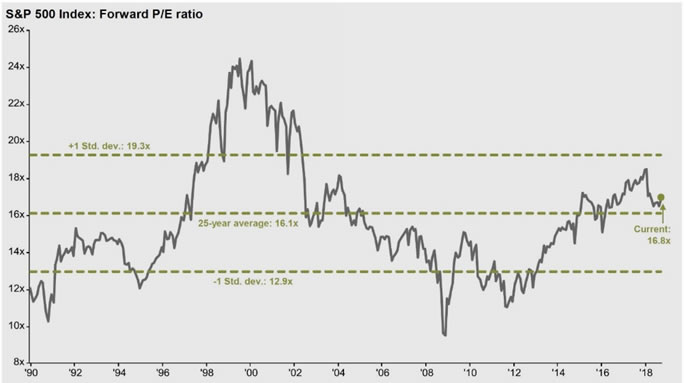
The final point to support our claim the current economic expansion will continue is the market is fairly valued. We define the “market” as the S&P 500. The chart below depicts the long-term valuation history of the S&P 500 Index, as measured by the Forward Price-to-Earnings (PE) Ratio. As you can see, over the previous 25-years the market sold at an average PE ratio of 16.1x. By comparison, today the market is selling at 16.8x. We view this as a fair valuation level considering continued economic expansion, growing corporate earnings and cash flows, and strengthening balance sheets.
In summary, when we look at the hard evidence, we see an economy that is poised to continue to grow, limited signs of a recession and a stock market that is valued in-line with historical averages. One bit of caution, markets can and will become overvalued and undervalued at certain times along the way. As previously stated, we currently view the markets as fairly valued. However, in the shorter-term market volatility is created when investors’ perceptions of value change. We closely analyze these movements, but remain focused on investing based on the long-term fundamentals.
Please find attached your third quarter 2018 portfolio review to supplement the monthly accounts statements available through Schwab. The report provides a performance summary of your portfolio compared to our benchmark S&P 500 Total Return Index and lists the portfolio holdings by industry sector.
As always, we are always excited to hear from you. Please do not hesitate to call us with any questions.
Sincerely,
Talbot Financial, LLC